What We’ve Learned from a Year of R.E.A.L.® Discussion Data
by Emily Gromoll and Izzy Guiliano
One of the ways teachers (and students) gauge growth in discussion skills as part of the R.E.A.L.® Discussion process is through the Student Survey and R.E.A.L.® Data Dashboard. Prior to starting R.E.A.L.® and every three discussions thereafter, students take a short, anonymized survey in which they report on their comfort level when it comes to using discussion skills in class, their feelings of belonging, and their sense of purpose. Their responses populate a class Dashboard that teachers use to make decisions about which skills or aspects of discussion to focus on for the next cycle. When teachers bring those cohort-level stats to their students, the students can set “team” goals and decide which skills they want to focus on as a whole class.
Although fundamentally we see the Survey and Dashboard as action-research tools for teachers – in other words, these are quick snapshots about how students are doing at various points in their R.E.A.L.® journey that teachers can act on quickly, as opposed to waiting until the end of the school year to study – we also know that we can learn a lot as an entire network by identifying trends and predictable patterns in students’ developmental trajectories.
This summer, our wonderful data analysis intern Izzy Guiliano, a rising senior at Villanova double-majoring in Statistics and Economics, spent her internship project digging into the data behind R.E.A.L.®! We asked Izzy to report on her findings and share observations about what she noticed when it came to students’ skill growth over the course of a year. Take it away, Izzy!
Digging into Discussion Data
Hi there! I’m Izzy Guiliano, a data analysis intern at R.E.A.L.®! This summer I took on the task of designing and conducting a research analysis of 3500+ student survey responses from students who used R.E.A.L.® in the 2023 – 2024 school year. As a data science student, I was drawn to this project because I was interested in seeing how data analysis could relate to classroom discussions and curious to see the impact R.E.A.L.® has on students’ growth.
When I first started this project, Emily Gromoll, R.E.A.L.® Program Director, explained that she had seen evidence of student growth in both descriptive and anecdotal data. In fact, one of the most telling pieces of information Emily frequently hears from teachers is that after a year of R.E.A.L.®, teachers in the next grade level report that students who have participated in the program are much more prepared for class discussion. Teachers report that students show higher levels of confidence asking questions, using evidence, and facilitating discussions on their own.
But a big question remained: were these trends statistically significant? Could we confirm through a deeper analysis that yes, students really do develop more of a sense of belonging and higher levels of comfort with discussion skills by using R.E.A.L.®? And importantly, do all students develop discussion skills in the same way, or do some experience growth at different rates and in different ways?
To find out, I designed a quantitative analysis. My analysis started with looking for general correlations and trends. Then, I disaggregated the data by personality types, grade levels, and specific skills to see the trajectory of growth. To measure each dimension, I created indices based on an average of the students’ responses to survey questions correlated with each skill. For my statistics nerds out there, I used t-tests, correlation analysis, and summary statistics to find these trends. From these calculations, I found 5 main takeaways about the impact of R.E.A.L. ® Discussions on students.
Finding #1: Skills + Belonging are Related
We wanted to understand if students’ sense of belonging was related to their growth in skills. When we talk about a sense of belonging, we’re talking about a student’s belief or perception that “someone like them could succeed in this class.” In other words, students feel that they belong when they think their perspective is valued by others in the class. Belonging is essential for the development of discussion skills, because it is connected to motivation and comfort with expressing ideas.
We started by asking the following questions: Does the R.E.A.L.® Discussion model lead to growth in skills and belonging, and is there a relationship between the two? We examined the correlation between belonging and skills separated by age for Middle and High School students. A strong positive correlation is classified as having a correlation coefficient between 0.6 and 0.8. As demonstrated in the graphs below, for Middle School students, the correlation coefficient was 0.78, and for High School students, it was 0.74, both showing a strong positive correlation. Thus, we can deduce that as students’ sense of belonging grows, their skills also improve, which is very exciting!
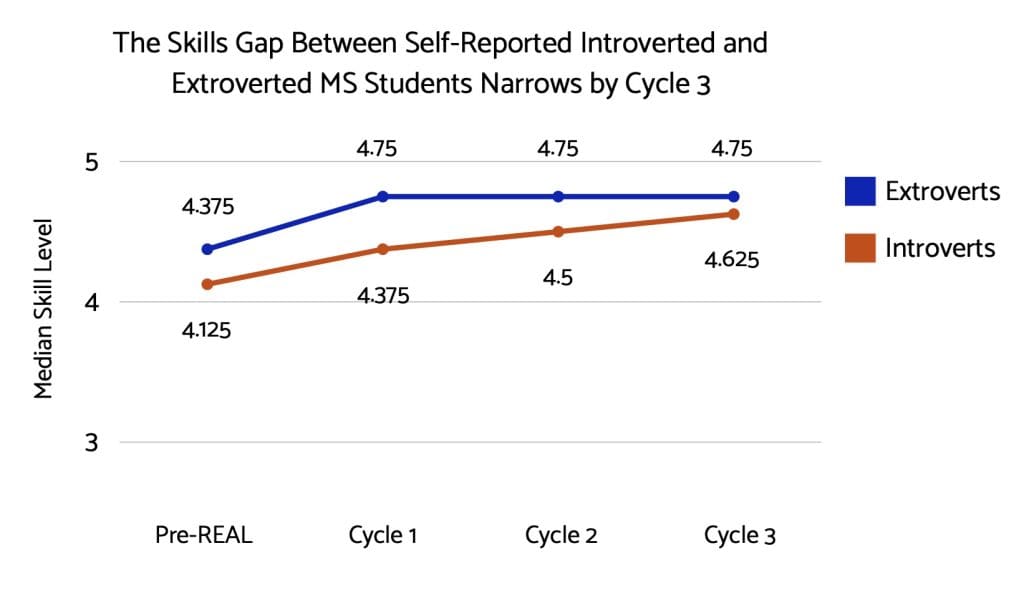
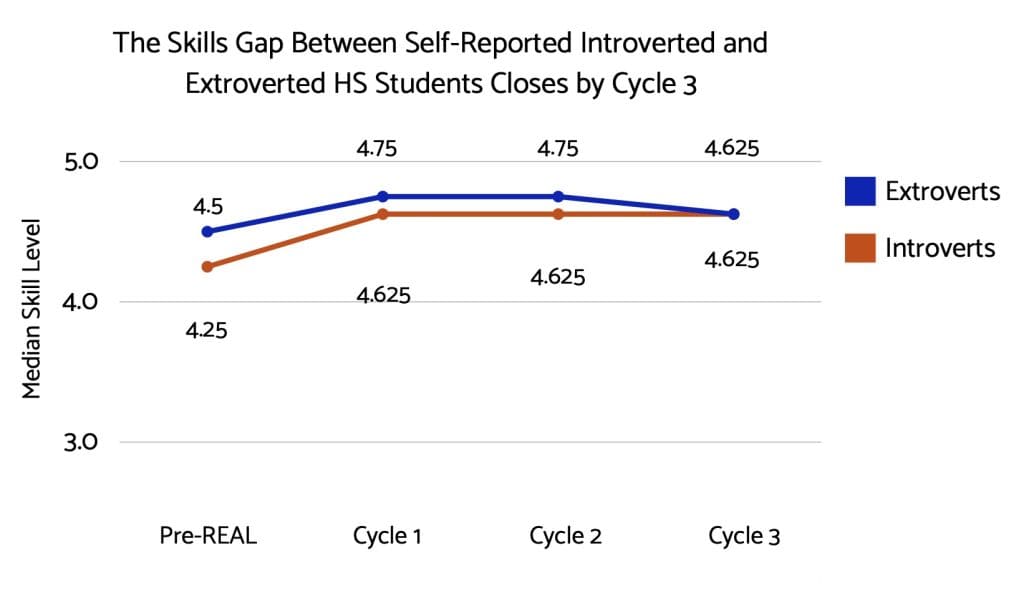
Finding #2: The Confidence Gap Between Introverts Extroverts Narrows by Cycle 3
After discovering a relationship between belonging and skills, we wondered if that applied to every student. In each survey, students are asked to self-report on which personality trait – introversion or extroversion – more accurately describes them. I looked at skills growth for each personality type separated by Middle and High School by creating an index.
I found that the story was different for the two personality types. Introverts generally reported starting at lower skill levels than extroverts early on in R.E.A.L.® Discussions; however, by Cycle 3 (after 9 discussions), the gap between introvert and extrovert skills was closed. Middle School students’ median overall skill index for introverts starts at 4.125, while extroverts are at 4.375. Cycle 3 introverts reported skill levels of 4.625, and extroverts reported 4.75. Here, you can see the gap has narrowed over the course of discussion cycles.
Similarly, for High School students, introverts start at a median skill index of 4.25, and extroverts are at 4.5. After Cycle 3, both introverts’ and extroverts’ median overall skill index is 4.625. Here, the gap is completely closed! Below are two graphs demonstrating for Middle and High School students the growth of skills across cycles for middle and high school students regarding their overall skills.
Finding #3: Asking is Worth the Wait!
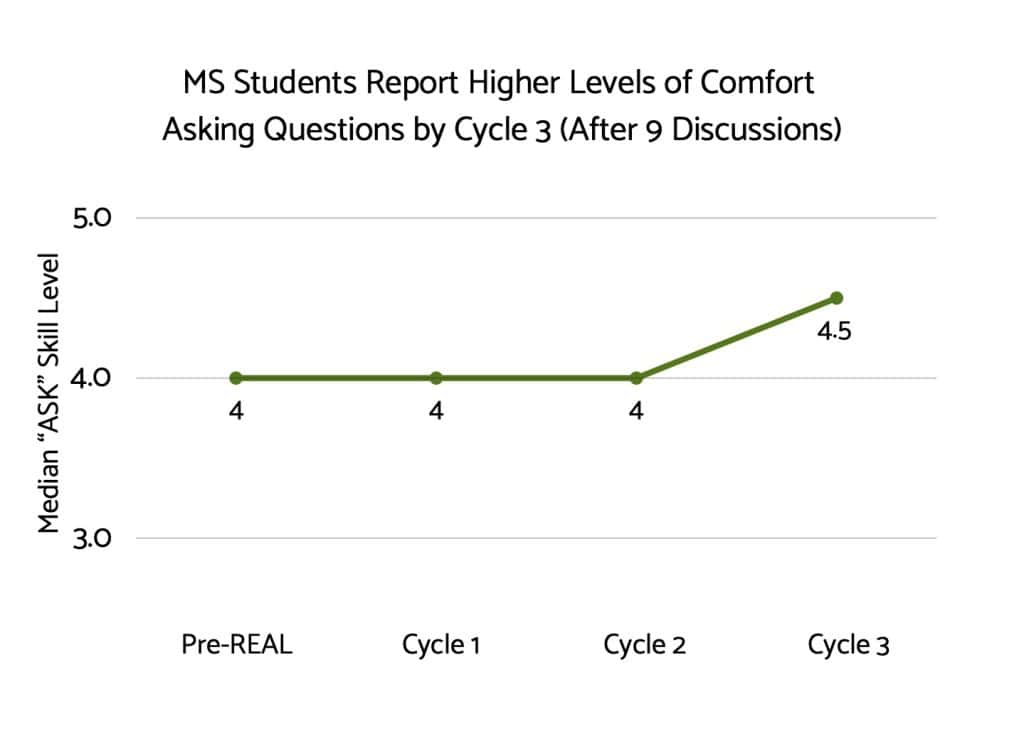
Seeing this growth in overall skills begged a new question: what did growth look like for each skill (i.e., Relate, Excerpt, Ask, and Listen)? Did they all follow the same growth pattern, or did specific skills take longer to develop than others? I looked at the growth rates of skills between each cycle and found that the Ask skill showed delayed growth. I looked at the median Ask skill level across Middle School students and saw that it remained constant from Pre-R.E.A.L.® to Cycle 2, then increased after Cycle 3, demonstrating delayed growth.
This made me wonder why it took students longer to feel comfortable asking questions in class discussions. Also, it highlighted the importance of continuing to practice the R.E.A.L.® Discussion model through Cycle 3 in order to help students fully develop their Asking skills.
Finding #4: Being Open to Open-Mindedness: Pushing Past the Plateau
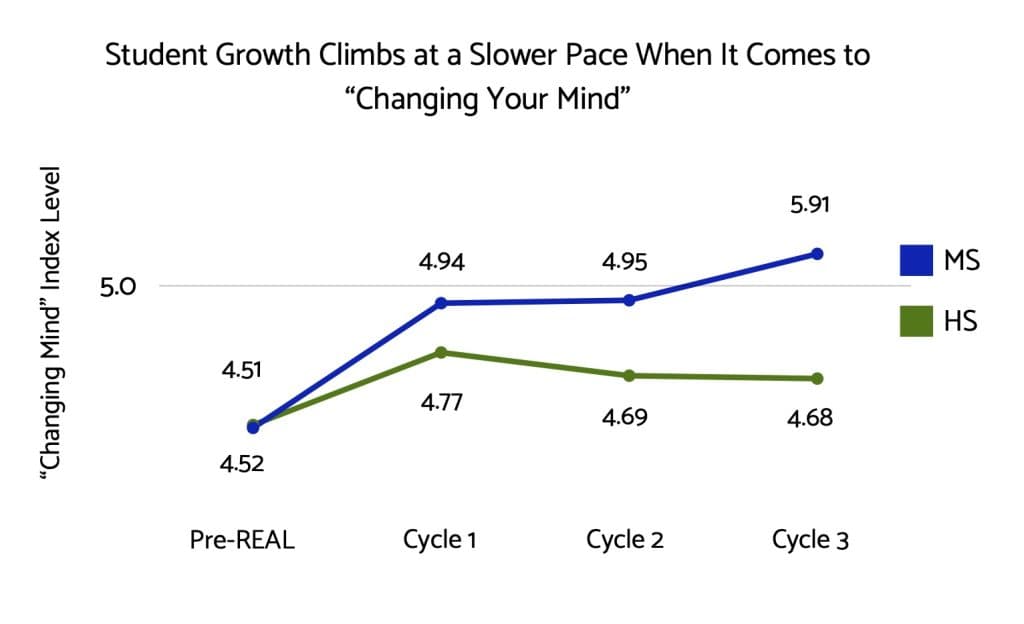
After seeing the delayed growth in the “Ask” skill, Emily and I were curious if there might be similarly delayed growth in some other aspects of discussion that we know can be challenging for students. We started with one of the newer questions we added to the survey this past year: “I feel comfortable changing my mind during discussion based on what my classmates say.” We were curious to see how responses developed over cycles within Middle and High School students, because a vast majority of teachers in our network report that openness to changing your mind can feel extra challenging for students.
Looking at students’ responses to this question of comfort changing their minds led us to more questions than answers. First, I created a “changing mind index” and calculated the mean for all Middle School students to evaluate how it changed over cycles. I discovered that Middle School students’ mean “changing mind index” increased by 10% after Cycle 1, then plateaued through Cycle 2, and finally increased by 3% after Cycle 3. My hunch is that this delayed growth could demonstrate the value of continuing to develop this skill over time, since it takes practice.
The story was a bit different for high school students. I calculated the “changing mind index” as a mean across all High School students. I found that high school students showed an increase of 6% after Cycle 1 and minor decreases after that. This pattern raised questions like: Is it more challenging for High School students to sustain a strong comfort level when changing their minds, and what dynamics in the classroom could make it less likely for students to change their minds?
Finding #5: Confidence in Learning to Disagree Jumps Quickly!
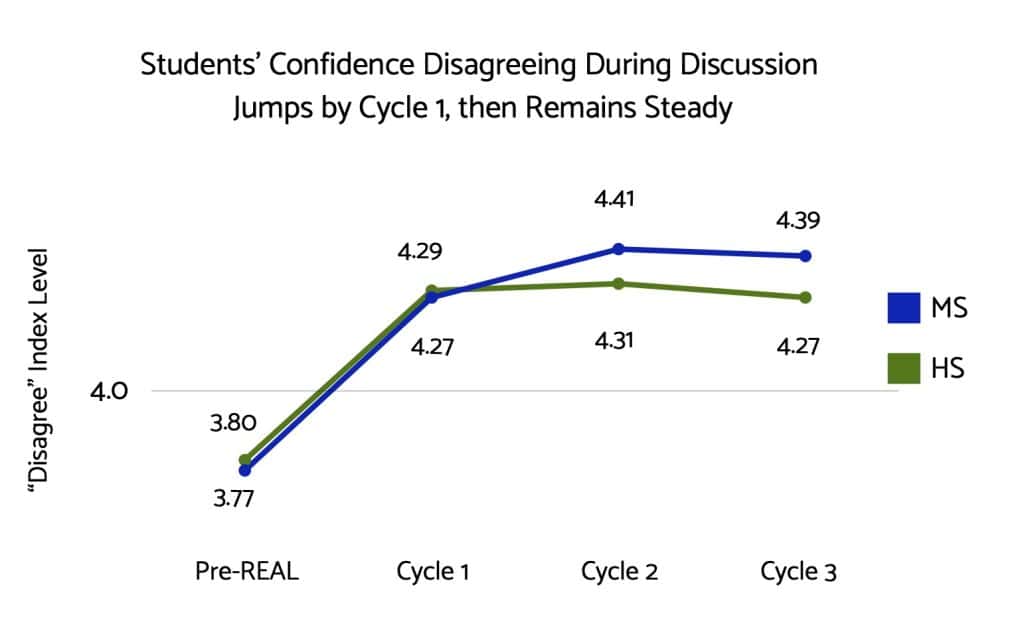
The last question I looked at focused on students’ comfort levels in disagreeing during class discussions. We wanted to see if Middle School and High School students would follow the same growth trajectory when it came to feeling comfortable disagreeing productively with each other – something we had heard can be very challenging for students who are eager to fit in with their peers or who might shut down when they feel like they are being personally attacked. During R.E.A.L.® discussions, students use their discussion skills to work on “disagreeing without being disagreeable” and focus on how they might disagree on an interpretation of a text in a way that focuses on their classmates’ ideas, not identities.
To study this question, I created a “disagree index” based on students’ responses to the question: “It feels hard or scary to disagree in a graded class discussion.” Separating students by Middle and High School, I looked at the mean “disagree index” for each cycle. I found that Middle and High School students followed a similar growth pattern. Both showed a 13% increase in their mean disagree index from Pre-R.E.A.L.® to Cycle 1, and their growth plateaued through Cycle 3. It could be that we see this pattern because students learn what it means to disagree in class, continue to practice that skill, and maintain that skill level as the cycles go on.
Some Answers, Lots of Questions, and So Much More to Explore
Overall, the quantitative data seems to confirm what we hear from teachers all the time: building discussion skills helps students feel a stronger sense of belonging in the classroom and strengthens their skills. Although the growth journey looks a bit different for each skill, those insights can actually be very valuable to teachers using R.E.A.L.® in their classrooms. They might be able to better predict when and how they’ll see jumps in student skill growth (e.g., students might master “Excerpt” and “Relate” a lot faster than “Ask”). Or they’ll know to expect that students’ comfort with disagreeing and changing their minds will start to increase by Cycle 3. Or perhaps this will beg new questions to explore, such as: how much can we say this growth is tied to the content we assign, or to the discussion questions, or to teachers’ feedback? For all of the data nerds out there, we’ll keep you posted as we learn more!


